
The System Service Table takes the following format as a data structure:

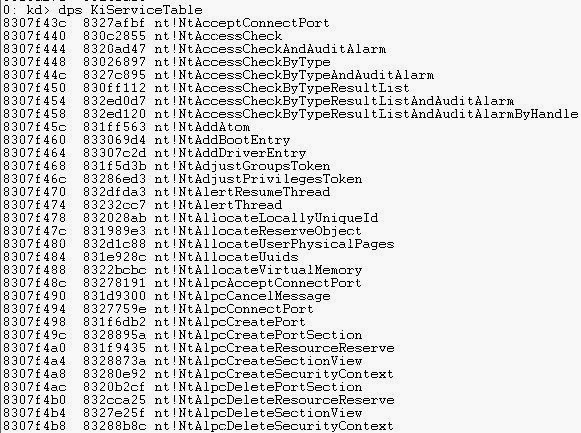
The SSDT as said before, is a array of function pointers to important system service routines. This true for the Shadow SSDT too. We can view these two tables in WinDbg, using the dps command and the name of the associated table.


Here's the Service Table used by the System Service Dispatch Table, this the array of function pointers to kernel routines.

Threads contain a pointer to either the System Service Table data structure or the Shadow System Service Table data structures, depending if they require the graphics routines to be called. Using the _KTHREAD data structure we can find the pointer to the table.


Another method is to check mismatched memory ranges in loaded modules, using the !chkimg extension with the -d parameter. This parameter searches the module address ranges for any mismatched regions, and then dumps these with the number of bytes, and the expected and found range.
I've taken a example from the WinDbg documentation, and will explain each part of the output.
The yellow highlighting shows the address range: start and end. The underling of the 2 bytes indicates the size of range, with the module name and function name with offset to start of the range. The brackets indicate the number of bytes since the last error.
The second line used with the red box, shows the expected byte values and then the found byte values associated with the image. The address range was greater than 8 bytes, then the byte values may be omitted to the first 8 bytes.
You can even use the !for_each_module extension with the !chkimg extension to use the extension on very loaded module in the system. The following format is used:
!for_each_module !chkimg @#ModuleName
References:
System Service Dispatch Table
Shadow SSDT Hook
Hooking Shadow SSDT on Windows 7
Great, Thanks !
ReplyDelete